Odin Ai uses pressure, rate, treatment, and geology context to calculate CFrac—a live measure of how the fracture system accepts fluid during pumping. That signal ties frac execution to production outcomes while the job is still underway.
Production varies with landing depth, rate schedule, fluid and proppant loading, geology, offsets, and execution quality. Teams usually see the full picture only after capital is spent and the well is on production.
That delay is not a people problem. It is a workflow problem: the field generates rich time-series data during pumping, but most organizations do not convert that behavior into a forward-looking production signal at stage level.
Odin Ai is built for a narrower question engineers can act on: what does this stage’s pressure and rate behavior imply about stimulated productivity, and what should change on the next stage or the next well?
Definition. CFrac (formerly referred to as C-Factor) is Odin Ai’s cumulative fracture compliance metric: it characterizes how much fluid the active fracture system accepts for a given fitted pressure response during pumping, integrated through the stage.
Not the same as shut-in compliance. Traditional fracture compliance is often discussed around closure tests or post-ISIP behavior. CFrac is different in use—it is built for live operations, when rate and pressure are moving and decisions still matter.
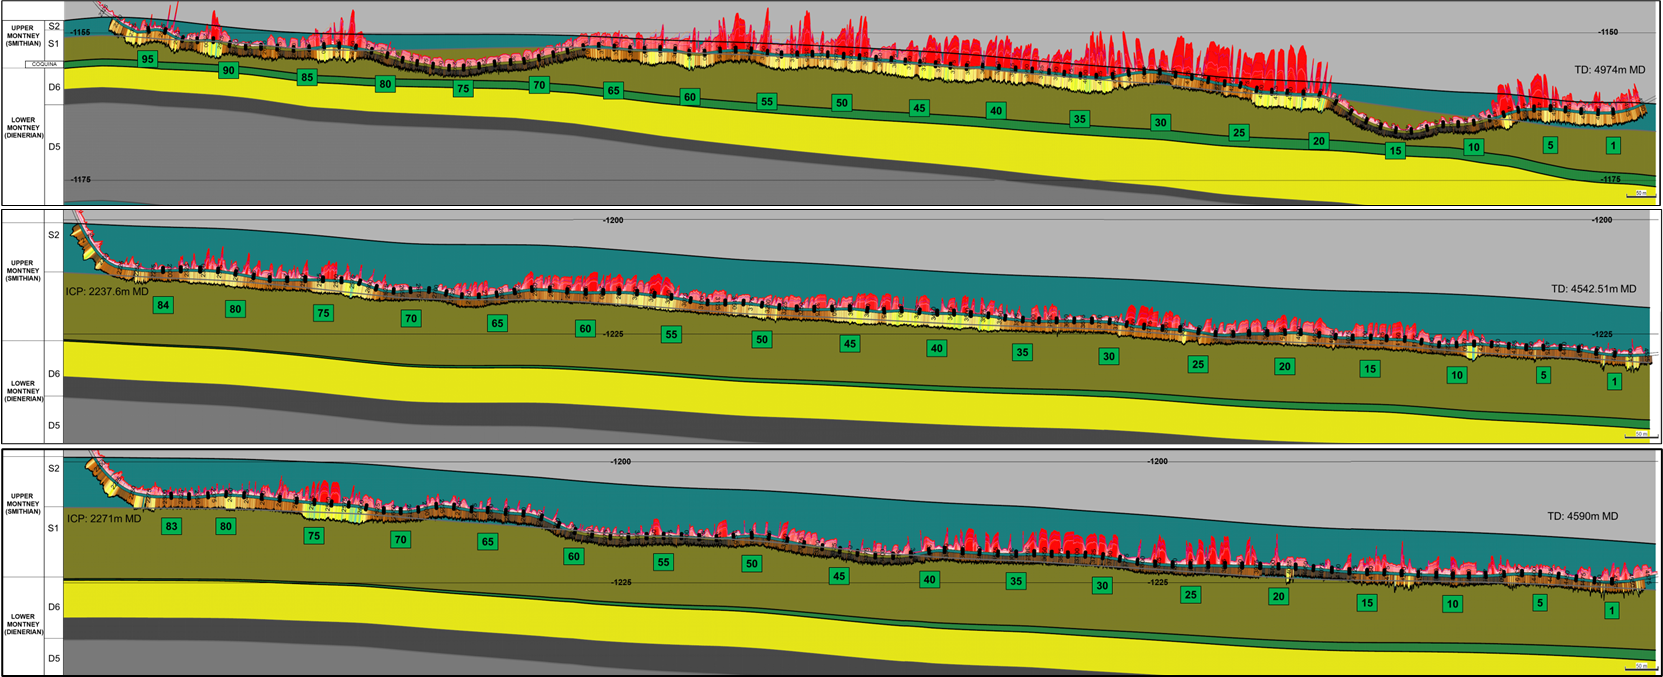
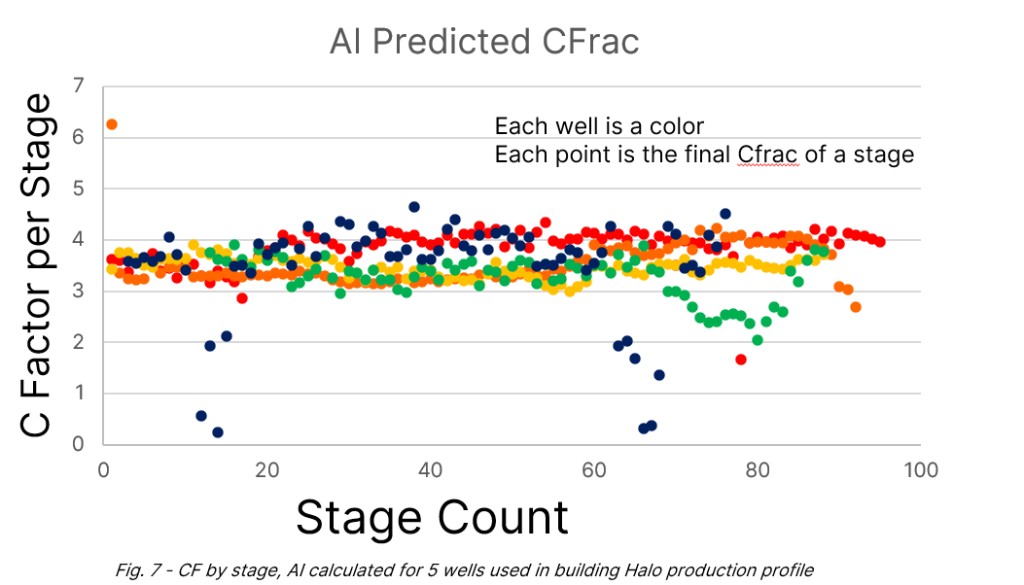
How to read the graphs. The MWD/geosteering view shows the familiar near-wellbore placement context engineers have used for years. The CFrac plot below it is different: each point is the final CFrac for a pumped stage, building a cumulative view of how the reservoir accepted fluid as the frac moved hundreds of feet from the wellbore.
Each point on the production profile is a well. Its CFrac value is the cumulative result of the stage-by-stage CFrac measurements shown above, summed into a single well-level measure of how effectively the frac system accepted fluid while pumping.
In Halo Exploration’s dataset, that cumulative CFrac showed a statistically significant relationship with six-month production. Odin Ai used a logistic production profile to estimate the thermodynamic upper limit of reservoir deliverability, giving operators a way to see whether a well appears under-stimulated, efficiently stimulated, or past the point of useful incremental stimulation.
A reserve well was held back from model training; its six-month oil rate was forecast from live CFrac while the frac was still pumping—and landed within a few percent of actual production. Rate behavior and landing depth emerged as major drivers of performance divergence, exactly the kind of operational levers completions and reservoir teams already control.
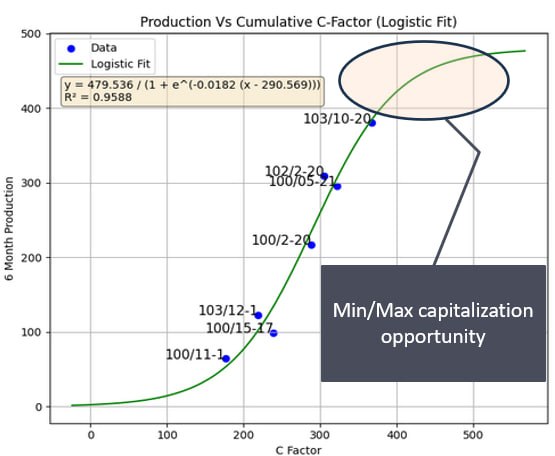
The x-axis is each well’s cumulative CFrac: the sum of final CFrac values from its individual stages. The logistic curve turns those well-level values into a production profile, including the upper deliverability limit where more stimulation stops adding meaningful production.
High-frequency frac data in. Stage-level CFrac and forecasts out.
Inputs. Pressure, rate, and treatment data from standard surface feeds; geology and well context where available.
Process. Physics-informed calculations—trained from large sets of manual rate–pressure work—generalize the relationship between pumping behavior and CFrac so it survives field noise and non-linearities.
Outputs. Stage-level CFrac time series, well aggregation, production forecasting where calibration data exists, and diagnostic views for landing depth, rate schedule, and design comparison.
Relate cumulative CFrac to producing outcomes so type curves and pad forecasts can be informed earlier—then stress-tested with blind wells where policy allows.
See when stage behavior lines up with landing relative to the pay target, and when porpoising or barrier breakthrough changes the response during pumping.
Quantify how rate ramps and interruptions change CFrac development in otherwise similar rock—so execution issues become measurable, not anecdotal.
Roadmap: combine CFrac growth targets with screen-out risk models so crews can push productive stimulation without crossing operational limits.
Use live CFrac growth alongside cost and schedule to judge whether continued pumping on a stage is justified before the treatment is closed.
SkyFrac is built on a founder-developed portfolio of granted patents and pending applications spanning hydraulic fracturing optimization, real-time analytics, and related sensing concepts—not a single slide deck.
The work is grounded in stage-level studies, operator-facing validation, and collaboration with experienced reservoir and completions practitioners.

This is the world’s first CFrac neural net, used in the Halo Exploration work. It generalized hand-checked rate–pressure physics into a model that runs on live frac data—intended for engineers who care about repeatability, not novelty.
Start with a technical review if you want to validate CFrac on representative wells, understand outputs, and map data requirements.
Choose a commercial discussion if you are ready to talk deployment scope, economics, and integration with existing workflows.